


Diving into crypto can feel overwhelming — especially when you open a trading app and see charts full of candles, lines, and numbers that look like a stock market alien language. But don’t worry — learning how to read crypto charts is easier than you think and one of the most important skills for becoming a smart trader or investor.
What Is a Crypto Chart?
A crypto chart is a visual representation of a cryptocurrency’s price over time. It shows how the price moves, helping you spot trends, patterns, and trading opportunities.
The most common type of chart used by traders is the candlestick chart — let’s start there.
Understanding Candlesticks (aka Candle Charts)
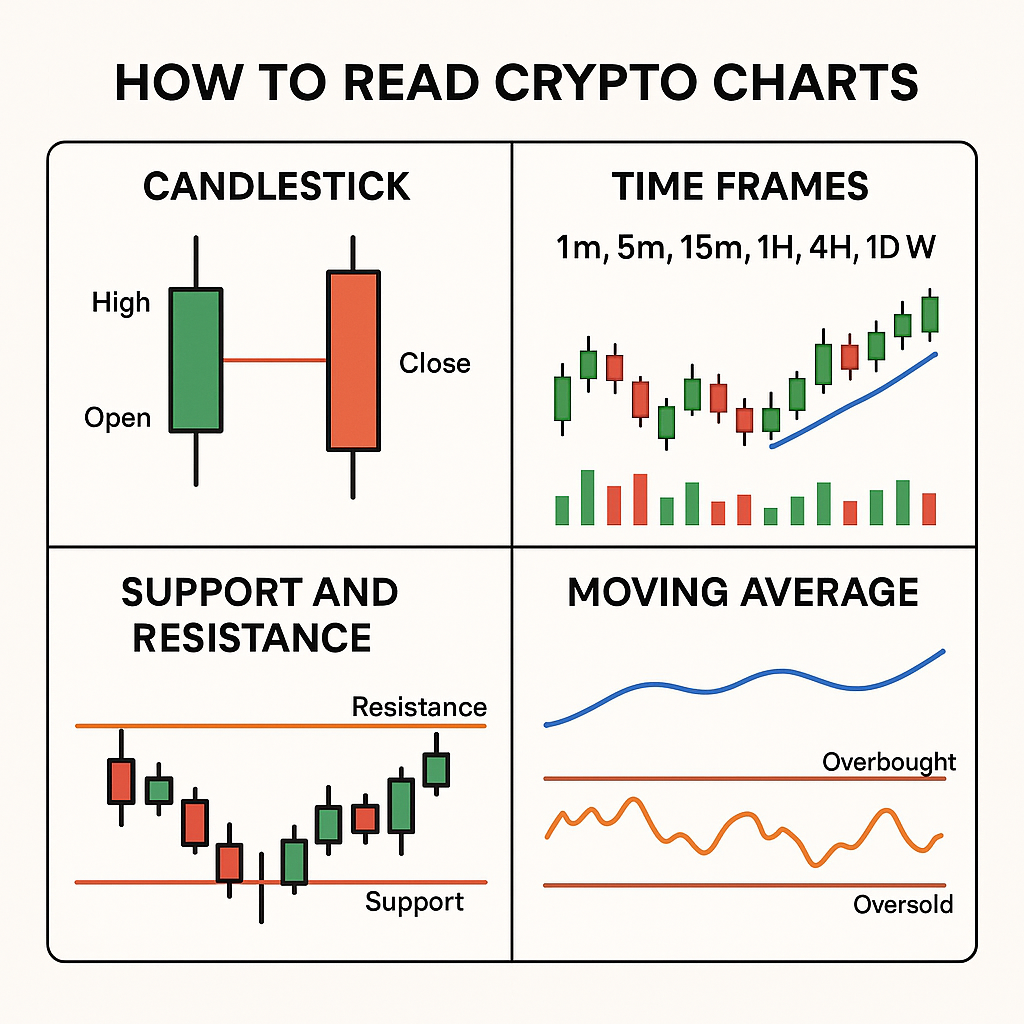
Each “candle” shows four key things about price movement over a set time (like 1 hour, 1 day, etc.):
- Open: The price at the start of the time period
- Close: The price at the end of the time period
- High: The highest price reached
- Low: The lowest price reached
🔴 Red Candle = Price went down
🟢 Green Candle = Price went up
Here’s a simple breakdown:
   High
     |
     |       Wick (line)
     |
  ┌──┐ <– Open (for red)
  │  │
  │  │ <– Body (price range between open & close)
  └──┘ <– Close (for red)
     |
     |
   Low
In a green candle, the Open is at the bottom and the Close is at the top.
In a red candle, the Open is at the top and the Close is at the bottom.
Time Frames: What Do the Intervals Mean?
Crypto charts can be set to different time frames:
- 1m, 5m, 15m – Great for short-term scalping or day trading
- 1H, 4H – Good for swing trading
- 1D, 1W – Best for long-term investing and identifying trends
Tip: Always look at multiple time frames before making decisions. A coin can be pumping on the 5-minute chart but crashing on the 1-day!
Key Chart Elements to Know
1. Support and Resistance
- Support = Price level where buyers tend to step in (price bounces up)
- Resistance = Price level where sellers take profits (price pulls back)
These are horizontal lines you draw across recent highs and lows.
2. Trend Lines
A line connecting a series of higher lows (for an uptrend) or lower highs (for a downtrend). Helps spot the direction of the market.
3. Volume Bars
Usually at the bottom of the chart. High volume = strong interest. Low volume = weak moves.
Popular Technical Indicators for Beginners
You don’t need to use dozens of indicators — just start simple:
✅ 1. Moving Averages (MA)
- Smooths out price to show the average over a period (e.g. 50-day or 200-day MA).
- Helps identify trend direction and possible reversals.
✅ 2. Relative Strength Index (RSI)
- Measures if a coin is overbought (>70) or oversold (<30).
- Can help you find good entry or exit points.
✅ 3. MACD (Moving Average Convergence Divergence)
- A bit more advanced, but great for spotting trend changes and momentum.
Quick Chart Reading Tips
- Zoom out: Don’t get trapped in the noise of short time frames. Always understand the bigger picture.
- Watch for patterns: Basic ones include triangles, flags, head & shoulders — they often repeat.
- Combine tools: One indicator alone is not enough. Use candlestick patterns + support/resistance + RSI for stronger signals.
⚠️ Don’t Rely Only on Charts
Charts are helpful, but not foolproof. Combine chart reading with:
- News and fundamental analysis
- On-chain data (like wallet activity)
- Your own risk tolerance and goals
And always remember — no one can predict the market 100%. Use charts to guide decisions, not guarantee profits.
Ready to level up? In the next post, we’ll dive into popular chart patterns and what they mean (like cup & handle, double bottom, and bull flags).
📬 Subscribe Telegram channel for updates, and happy charting!